How to find the range of a Data Set: A Complete Guide:
How far apart the numbers are you’re working with – and what does that say about your data? Whether its student scores, daily temperature, or business profits, numbers don’t just matter – their spread tells a deeper story. That’s where the concept of ranges comes in. Simple yet powerful, calculating the range helps you uncover patterns, identify outliers, and make smarter decisions in just seconds.
In this guide, we’ll explore what the range is, why it matters, and how to calculate it –with practical examples, tips, and common mistakes to avoid.
What is the Range in a Data Set?
In statistics, the range is the difference between the highest and lowest values in a data set.
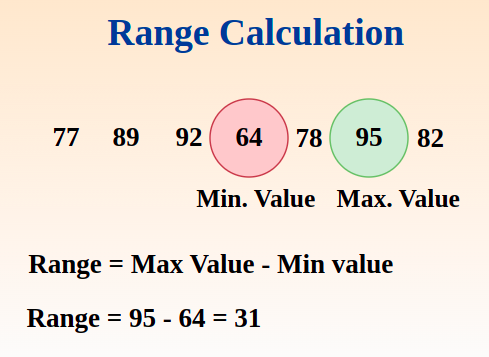
Formula:
Range = Maximum Value – Minimize Value
It’s a simple concept, but it provides important insight into the variability of your data. A small range suggests that the values are closely grouped, while a large range indicates more variation.
Why Range is Important?

The range gives a quick snapshot of how spread out the data is. While it’s not as comprehensive as tools like standard deviation or variance, it is useful in many contexts, including:
- Understanding variability: Quickly measure the extent of data spread.
- Spotting outliers: A high range might signal unusual values.
- Making comparisons: Compare variation across different data sets.
- Quick analysis: Get fast insights without complex calculations.
In short the range, gives you a quick glimpse into how consistent – or un predictable – your data truly is.
How to Find the Range: Step-by-Step

Now that you understand what the range is and why it matters, it’s a time to learn how to calculate it yourself. The best part? It’s quick, simple, and requires only basic subtraction. Even you’re not a math expert; you can easily find the range of data set.
Let’s go through the steps together:
Step 1: List the Values
Write down all the numbers in the data set. They don’t need to be in any particular order, though sorting can make it easier to identify the minimum and maximum. This allows you to gain the better understanding of how your values differ from each other.
Tip: Listing the values in order (from smallest to largest) isn’t required, but it can help you easily spot the highest and lowest numbers.
Example Data Set:
Data set: 8, 3, 15, 10, 6
Step 2: Identify the Minimum and Maximum Values
Next, scan your data set carefully to locate the smallest (minimum) and largest (maximum) values. These two numbers are essential because they define the full span of your data. Take your time with this step – especially if list is long or unsorted as overlooked number can affect the accuracy of the range.
You can also highlight or underline them to make the subtraction easier.
In example above:
- Minimum = 3
- Maximum = 15
This step is crucial, as the accuracy of your range depends entirely on correctly identifying these two numbers.
Step 3: Subtract the Minimum from the Maximum
Once you’ve identified the minimum and maximum values, it’s time to calculate the range. This step helps you quantify the spread of your data in a single, easy-to-understand number. No advanced calculations are needed – just a basic subtraction will do the job.
Let’s see how to apply the formula:
Now, apply the simple formula:
Range = Maximum Value Minimum Value
Using our example:
Range = 15 – 3 = 12
So, the range of this data set is 12.
This tells you there’s a 12-unit gap between the smallest and largest values.
Real-Life Examples:
Now that you know how to calculate the range step by step, let’s see how it works in everyday situations. These real-life examples will help you understand the concept more clearly and show how useful the range can be.
Example 1: Exams Score
A teacher wants to know how much test scores vary among students. Here are the results:
72, 88, 95, 91, 67
- Max = 95
- Min = 67
- Range = 95 – 67 = 28
Interpretation: There’s a 28-point difference between the highest and lowest scores, indicating a moderate spread.
Example 2: Weekly Temperatures
A meteorologist records the daily high temperatures for a week:
22, 25, 30, 28, 24, 21, 29
- Max = 30
- Min = 21
- Range = 30 – 21 = 9°C
Interpretation: A relatively stable temperature pattern with a small range.
Common Mistakes to Avoid:
These are the common mistakes you must avoid:
- Confusing the range with the mean or median: The range measures spread, not the center of the data.
- Overlooking outliers: Outliers can drastically increase the range, so always review your data carefully.
- Forgetting to subtract correctly: Make sure you always subtract the minimum from the maximum, not the other way around.
The Bottom Line:
The range is one of the simplest yet most valuable tools in statistics. By finding the difference between the highest and lowest values, you get a clear picture of how much your data varies. Whether you’re a student, analyst, or everyday problem-solver, knowing how to find the range helps you analyze information more effectively and make better decisions.
So next time, you’re faced with a list of numbers, don’t just average them – find a range, and see what the numbers are really telling you.


